Planetopia
Museum Exhibition
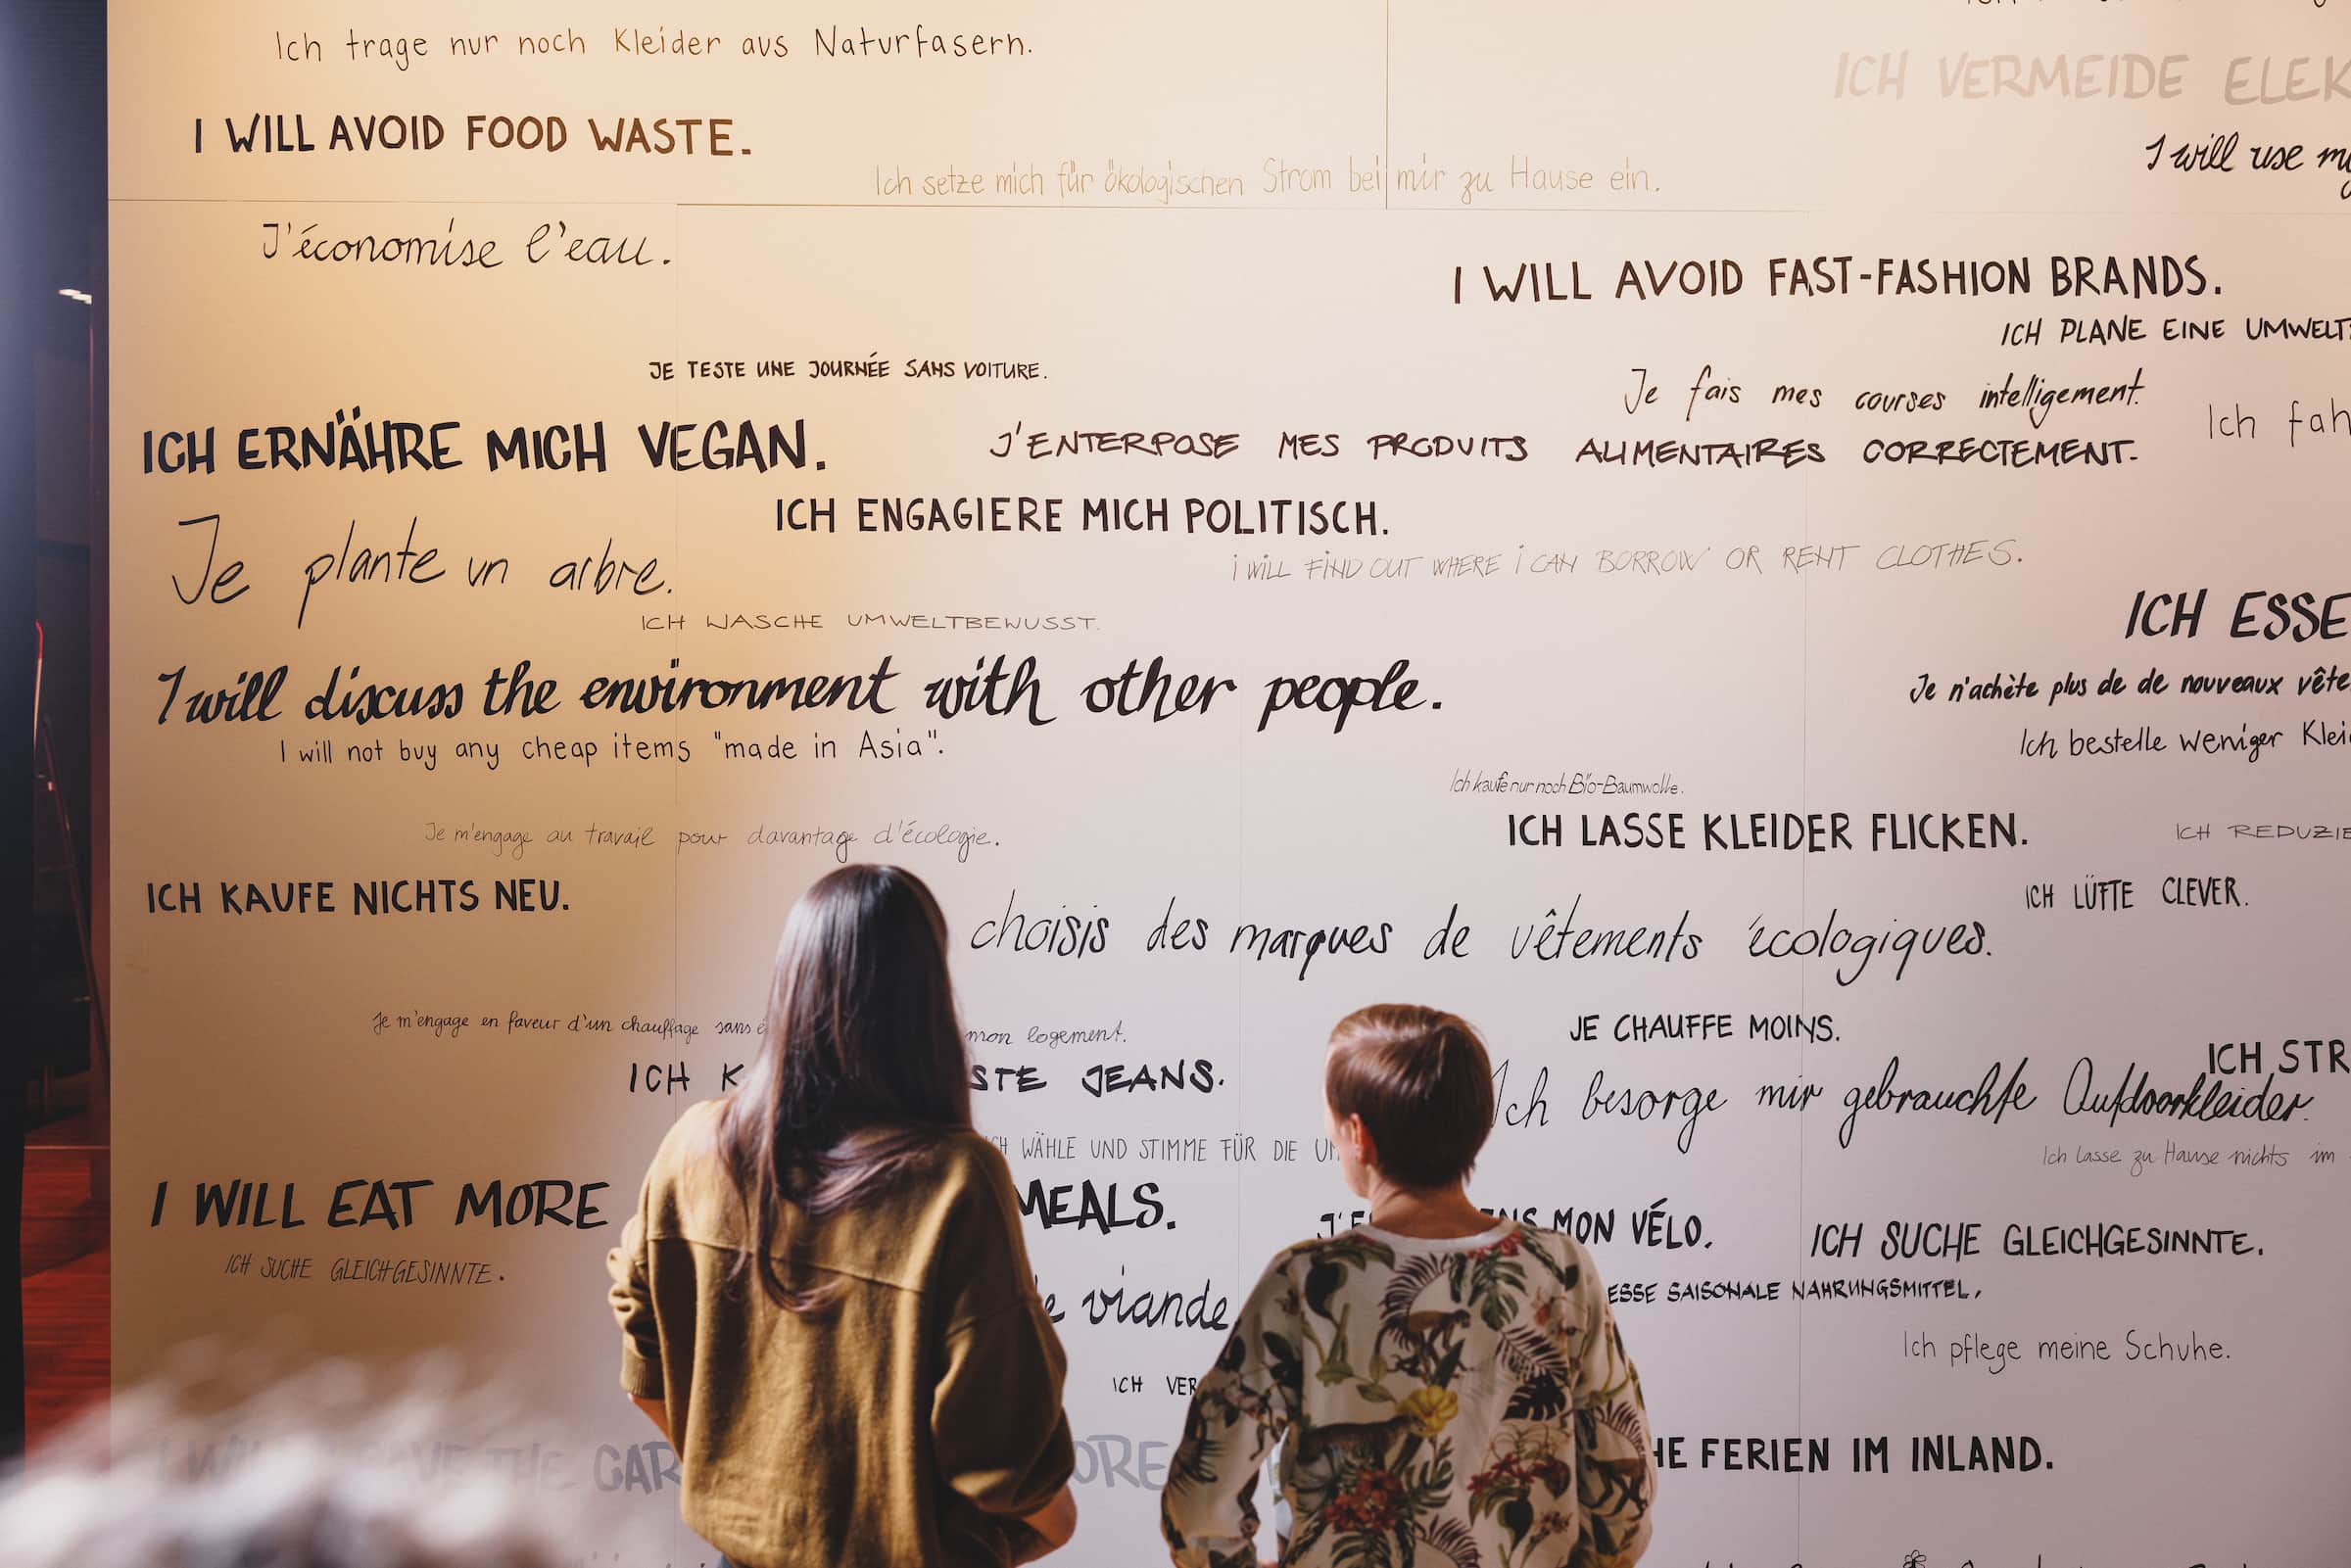
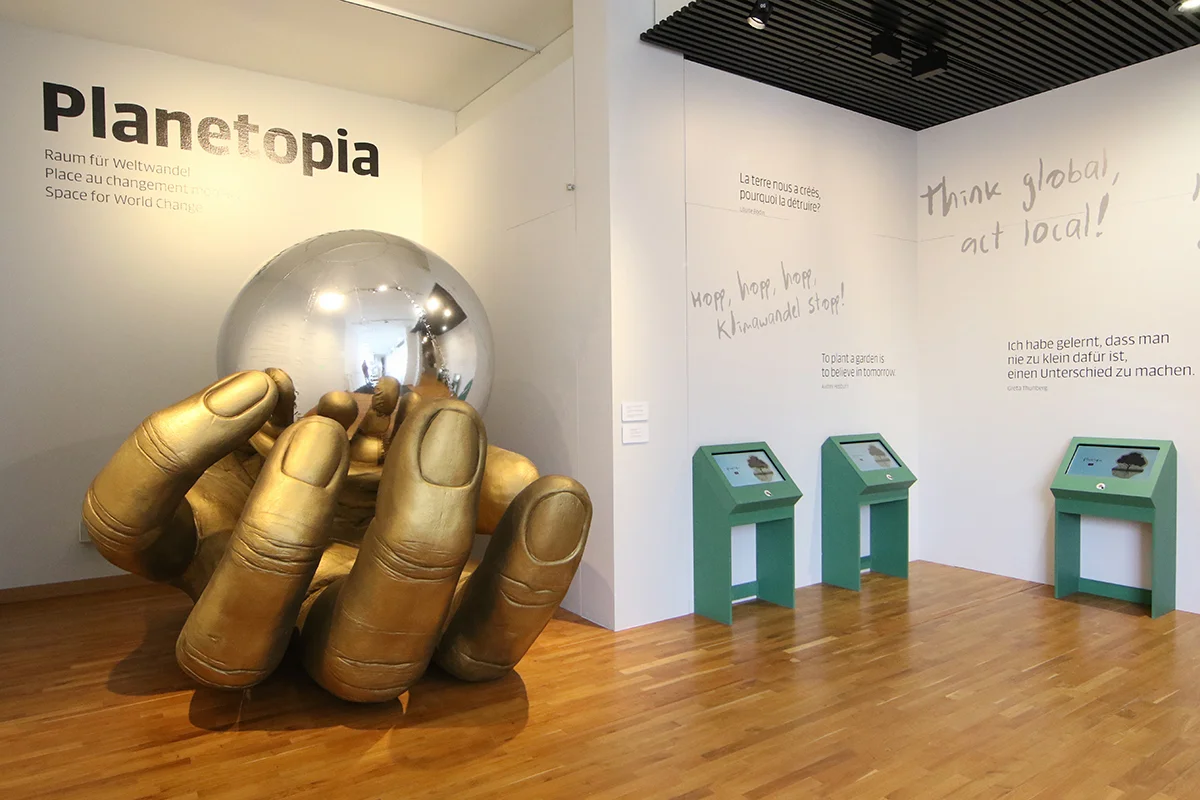
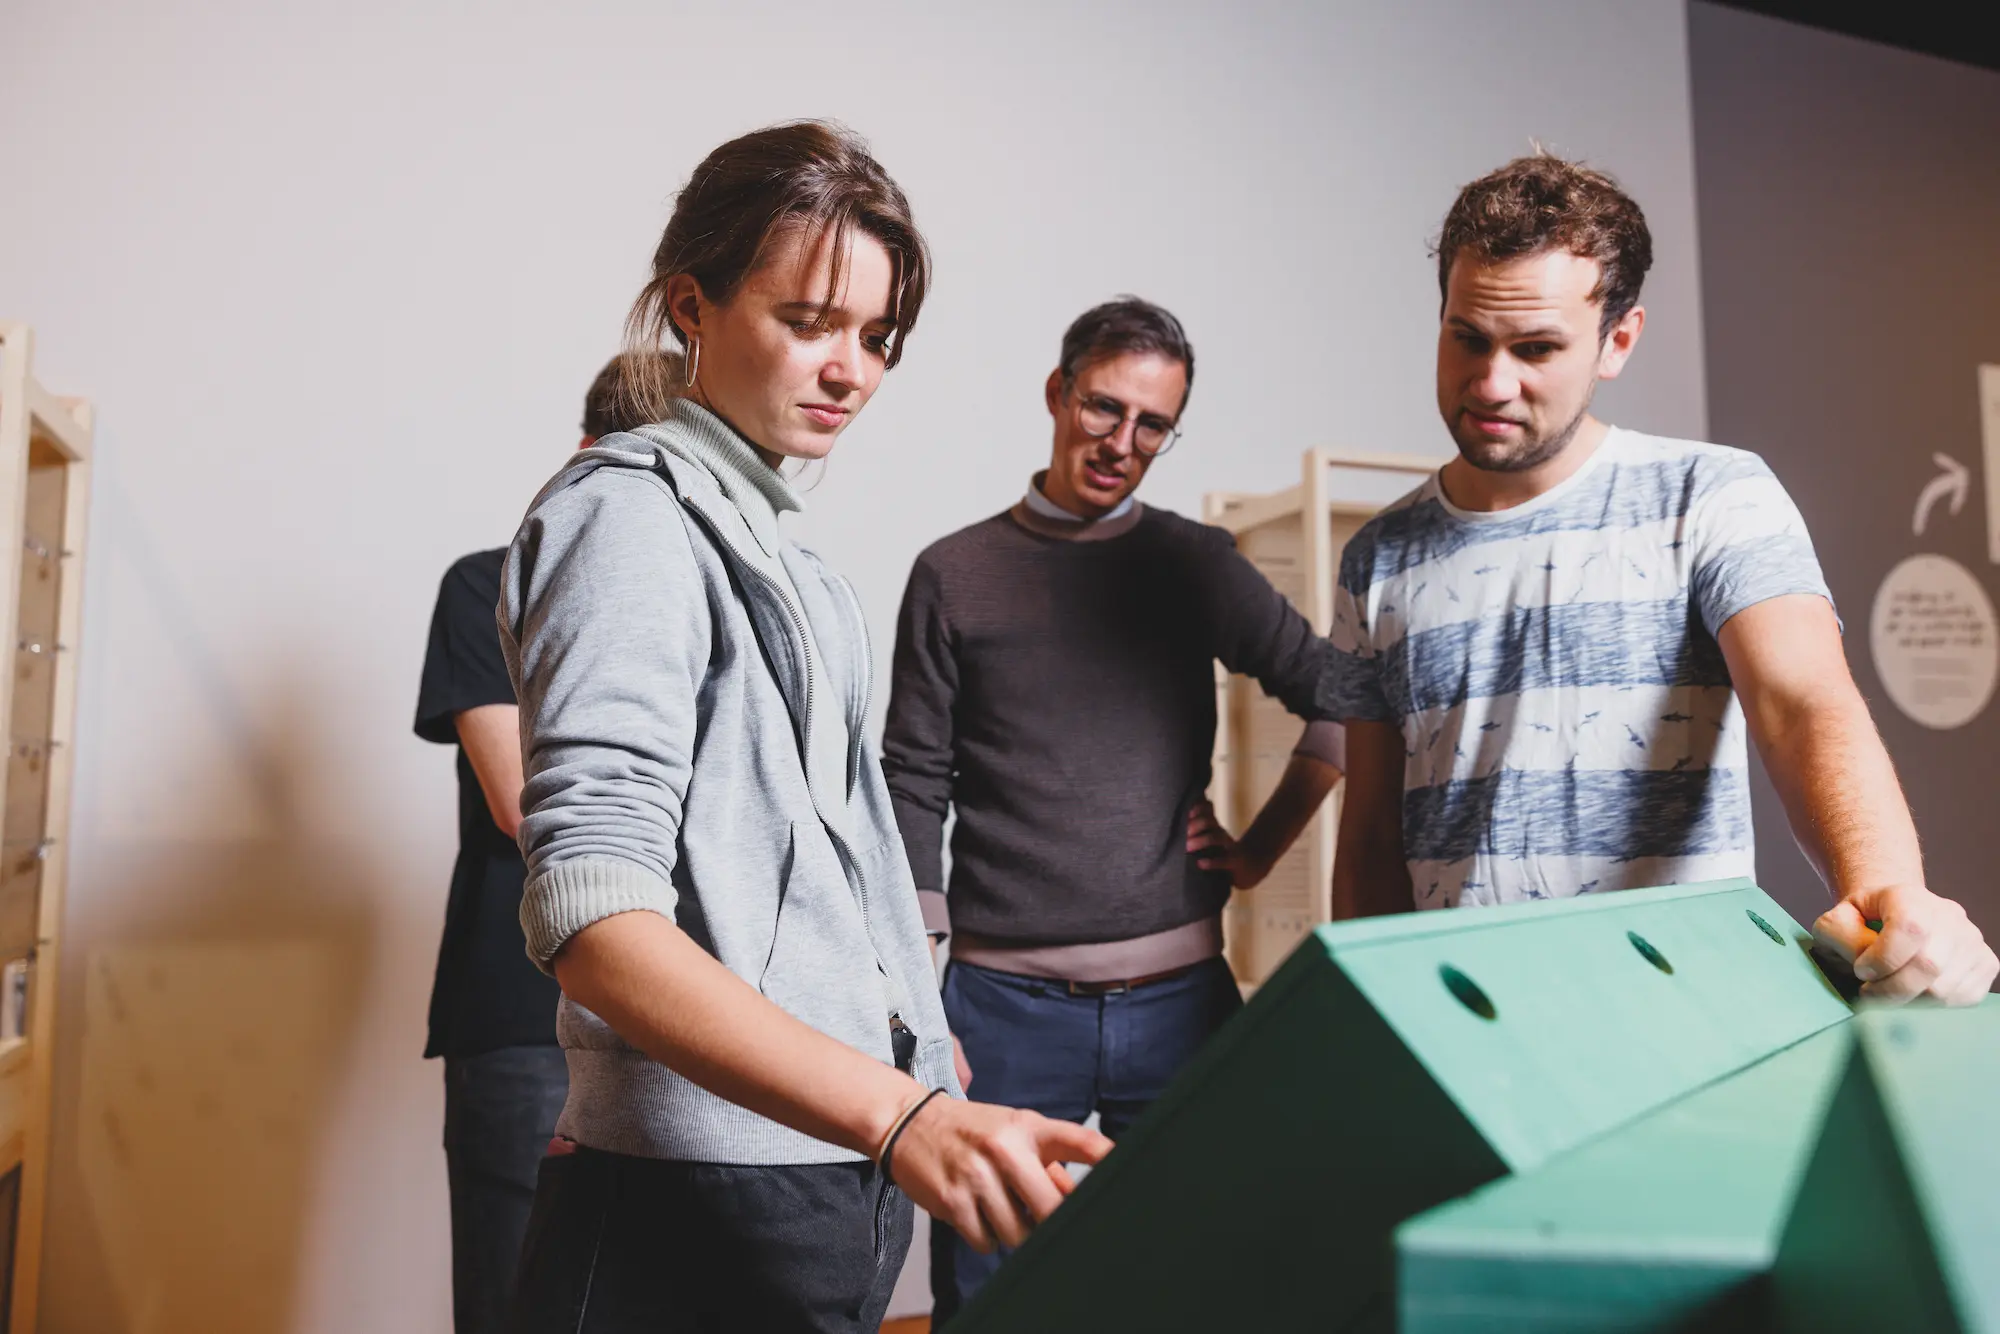
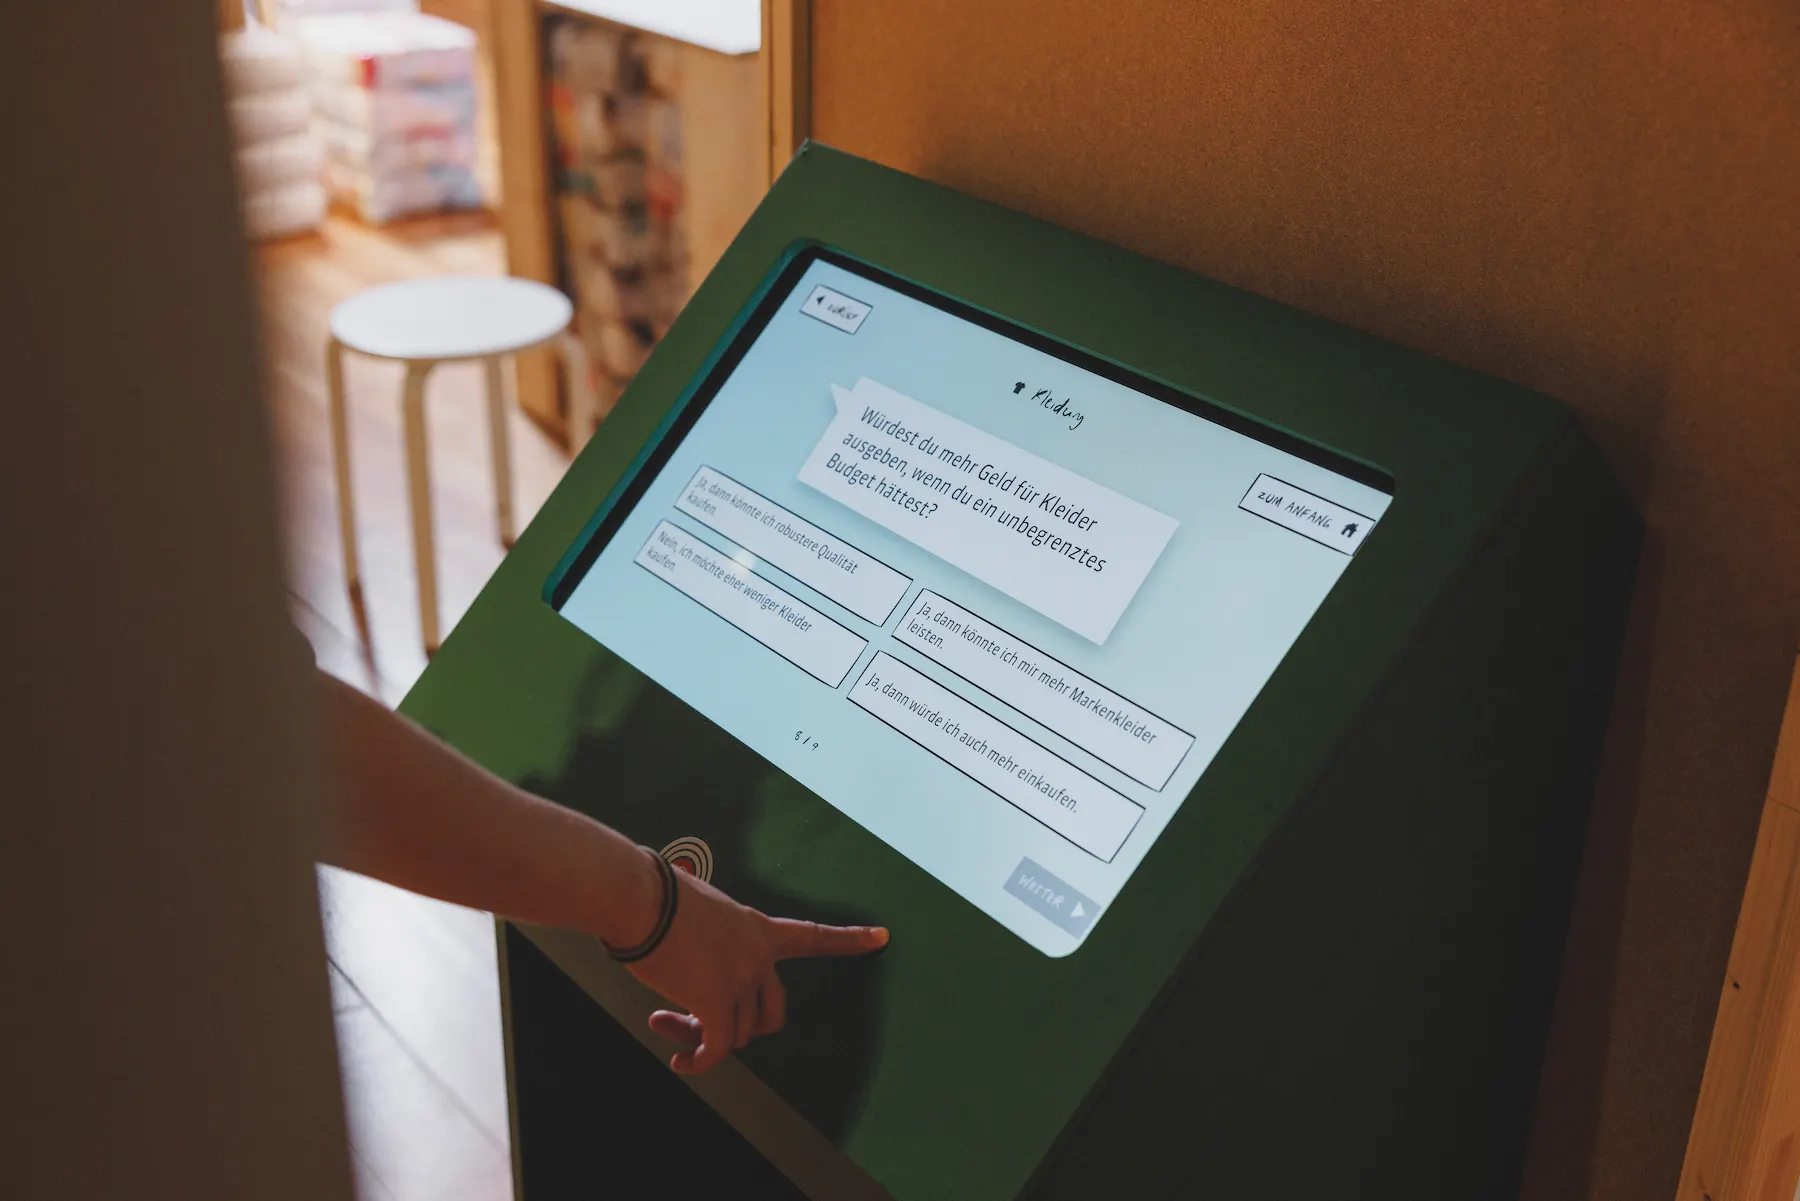
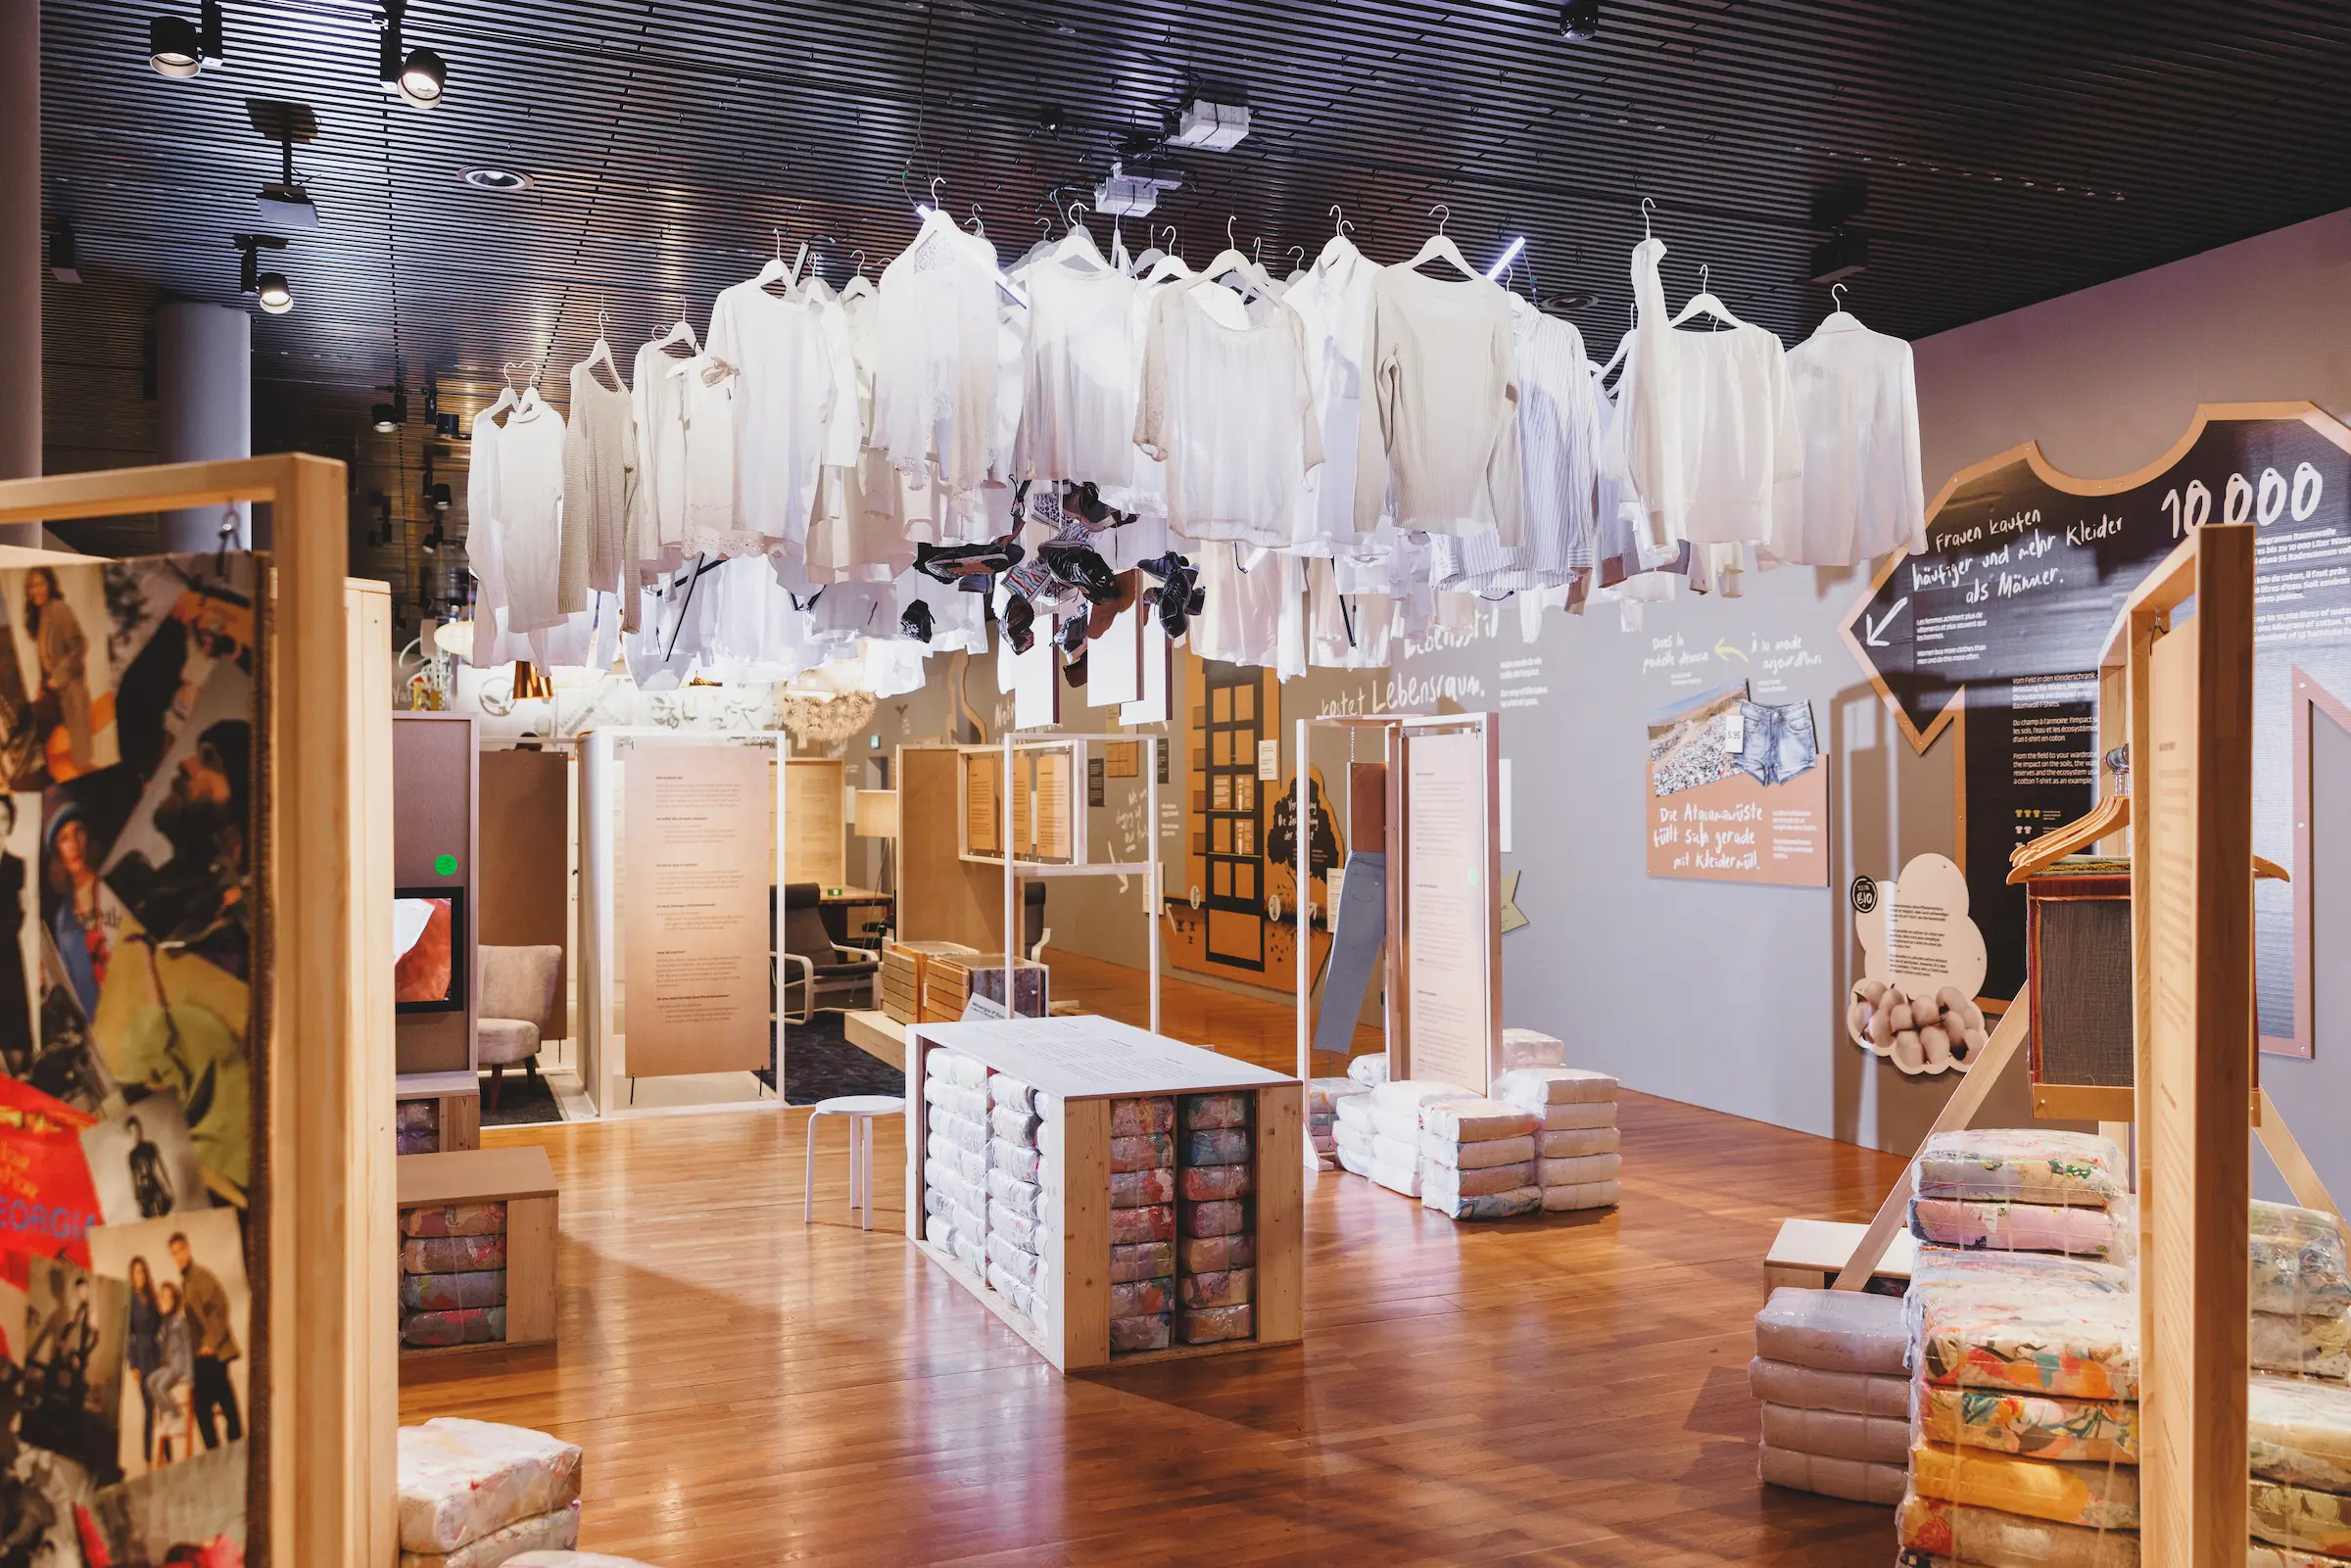
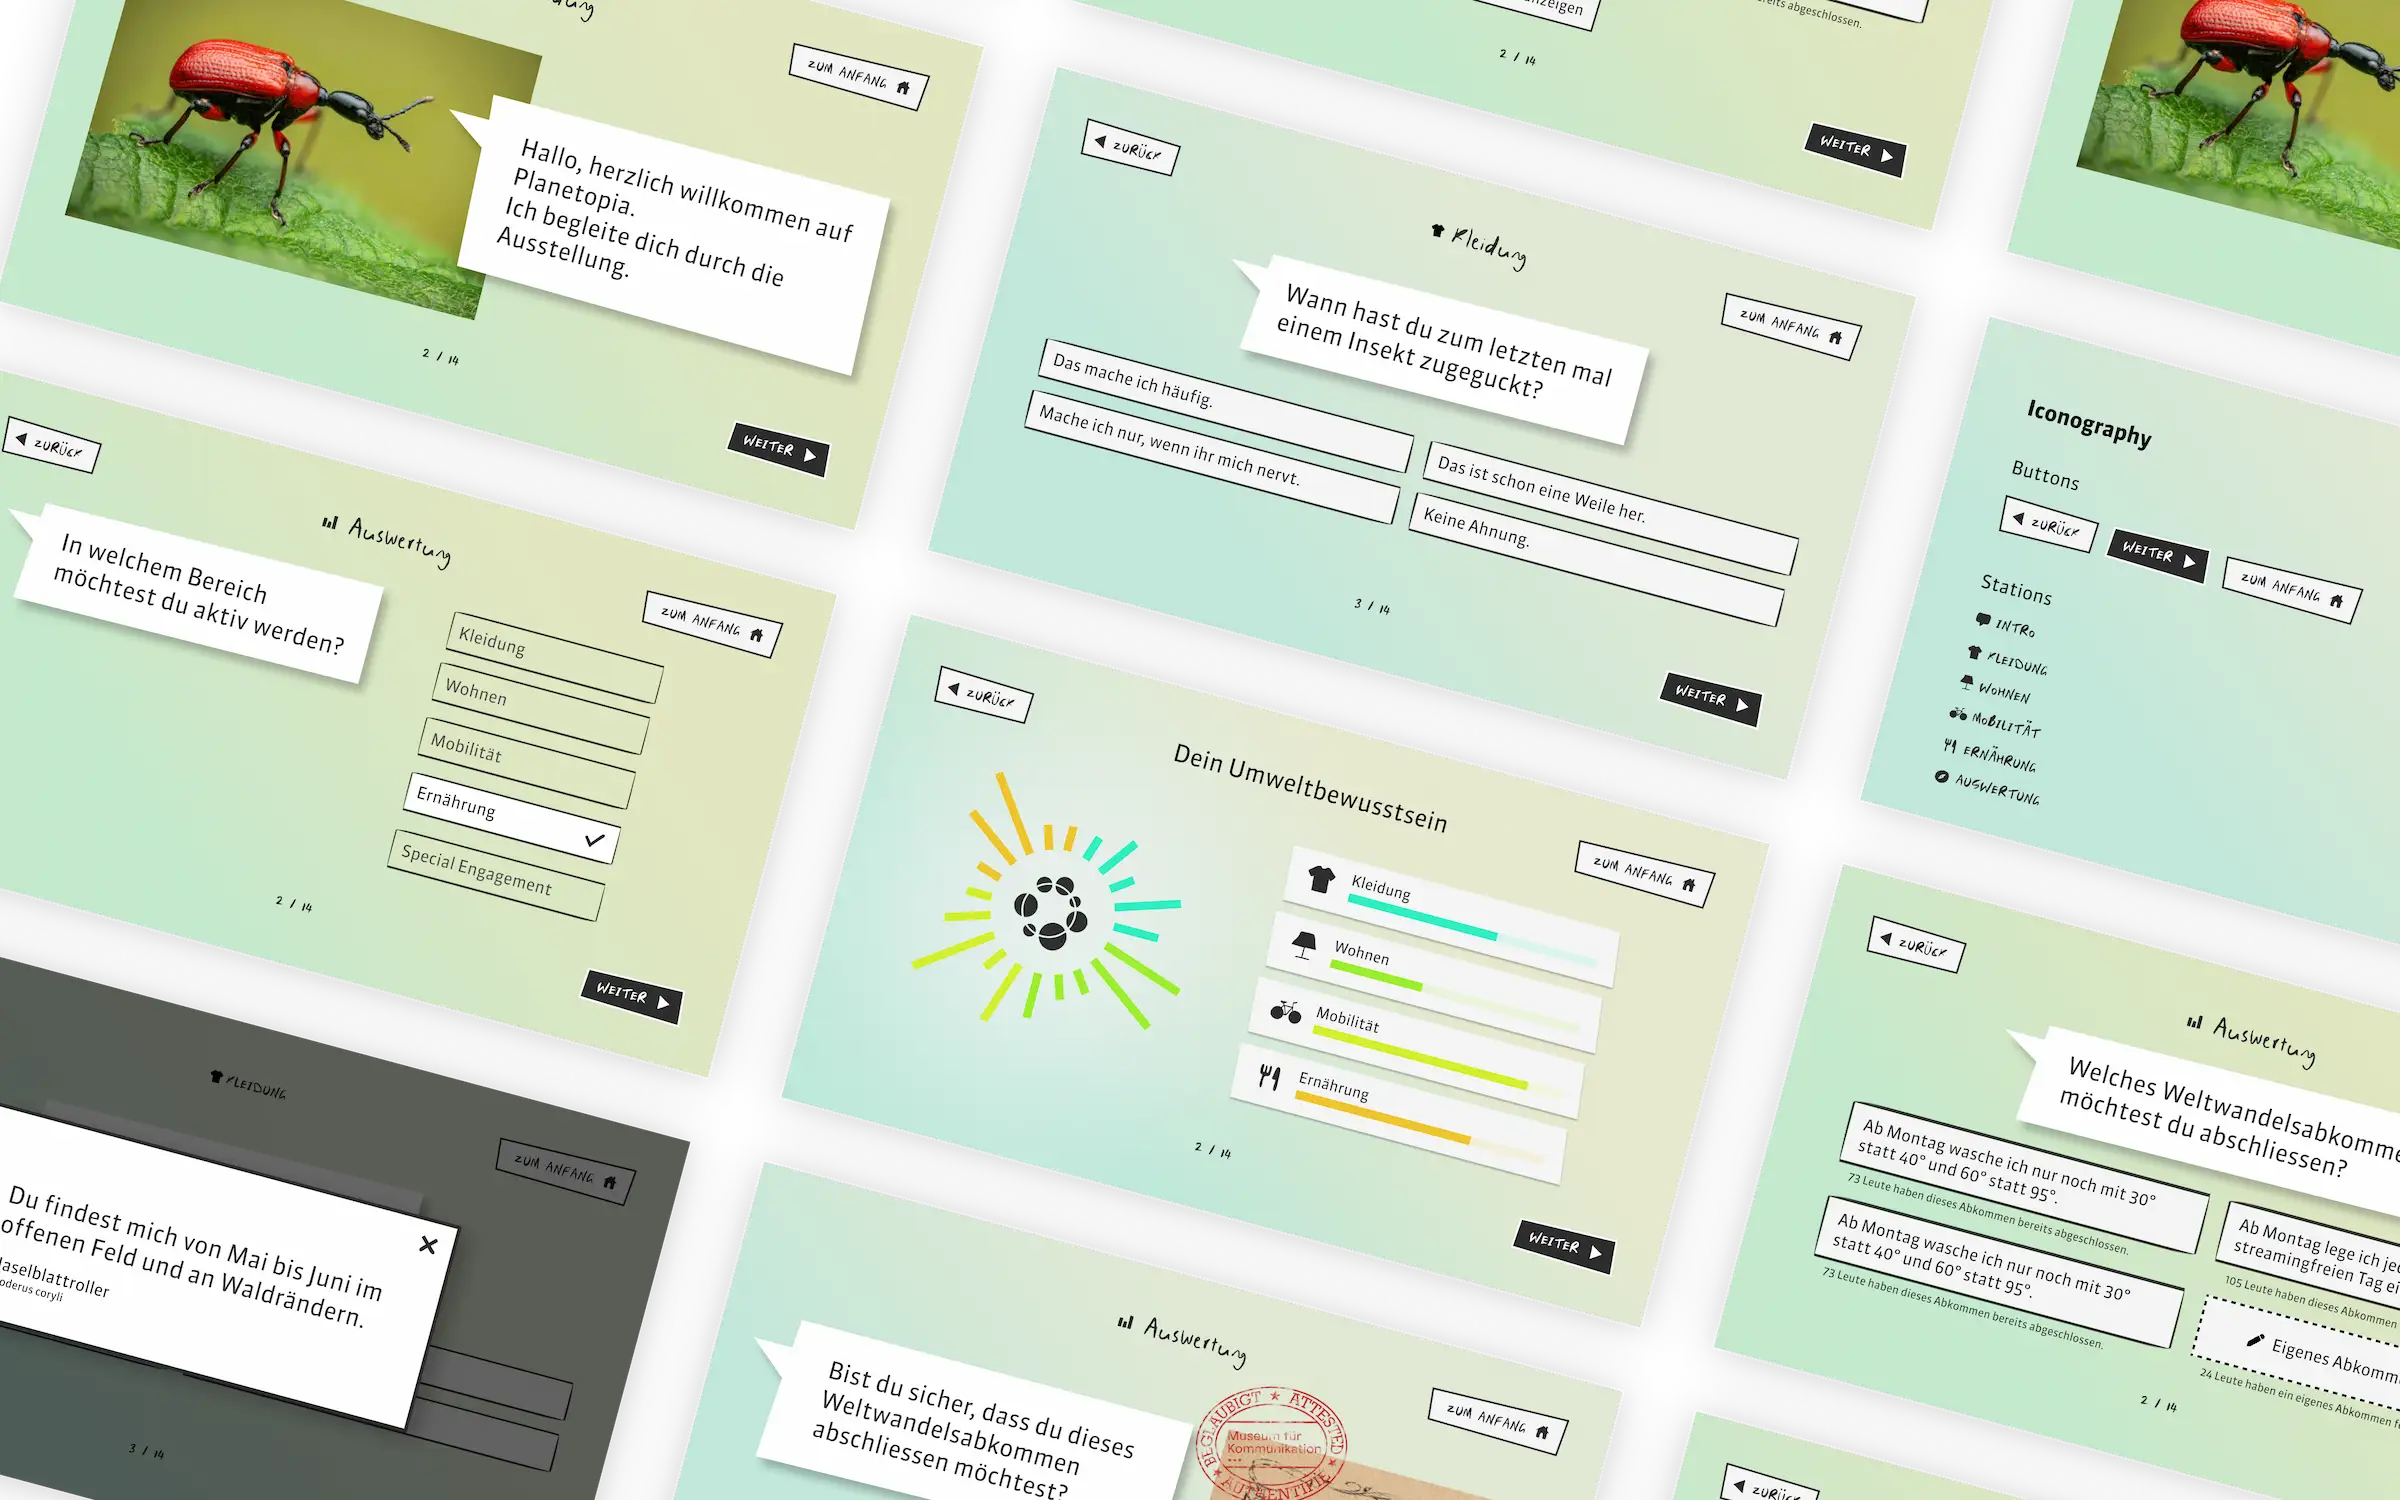
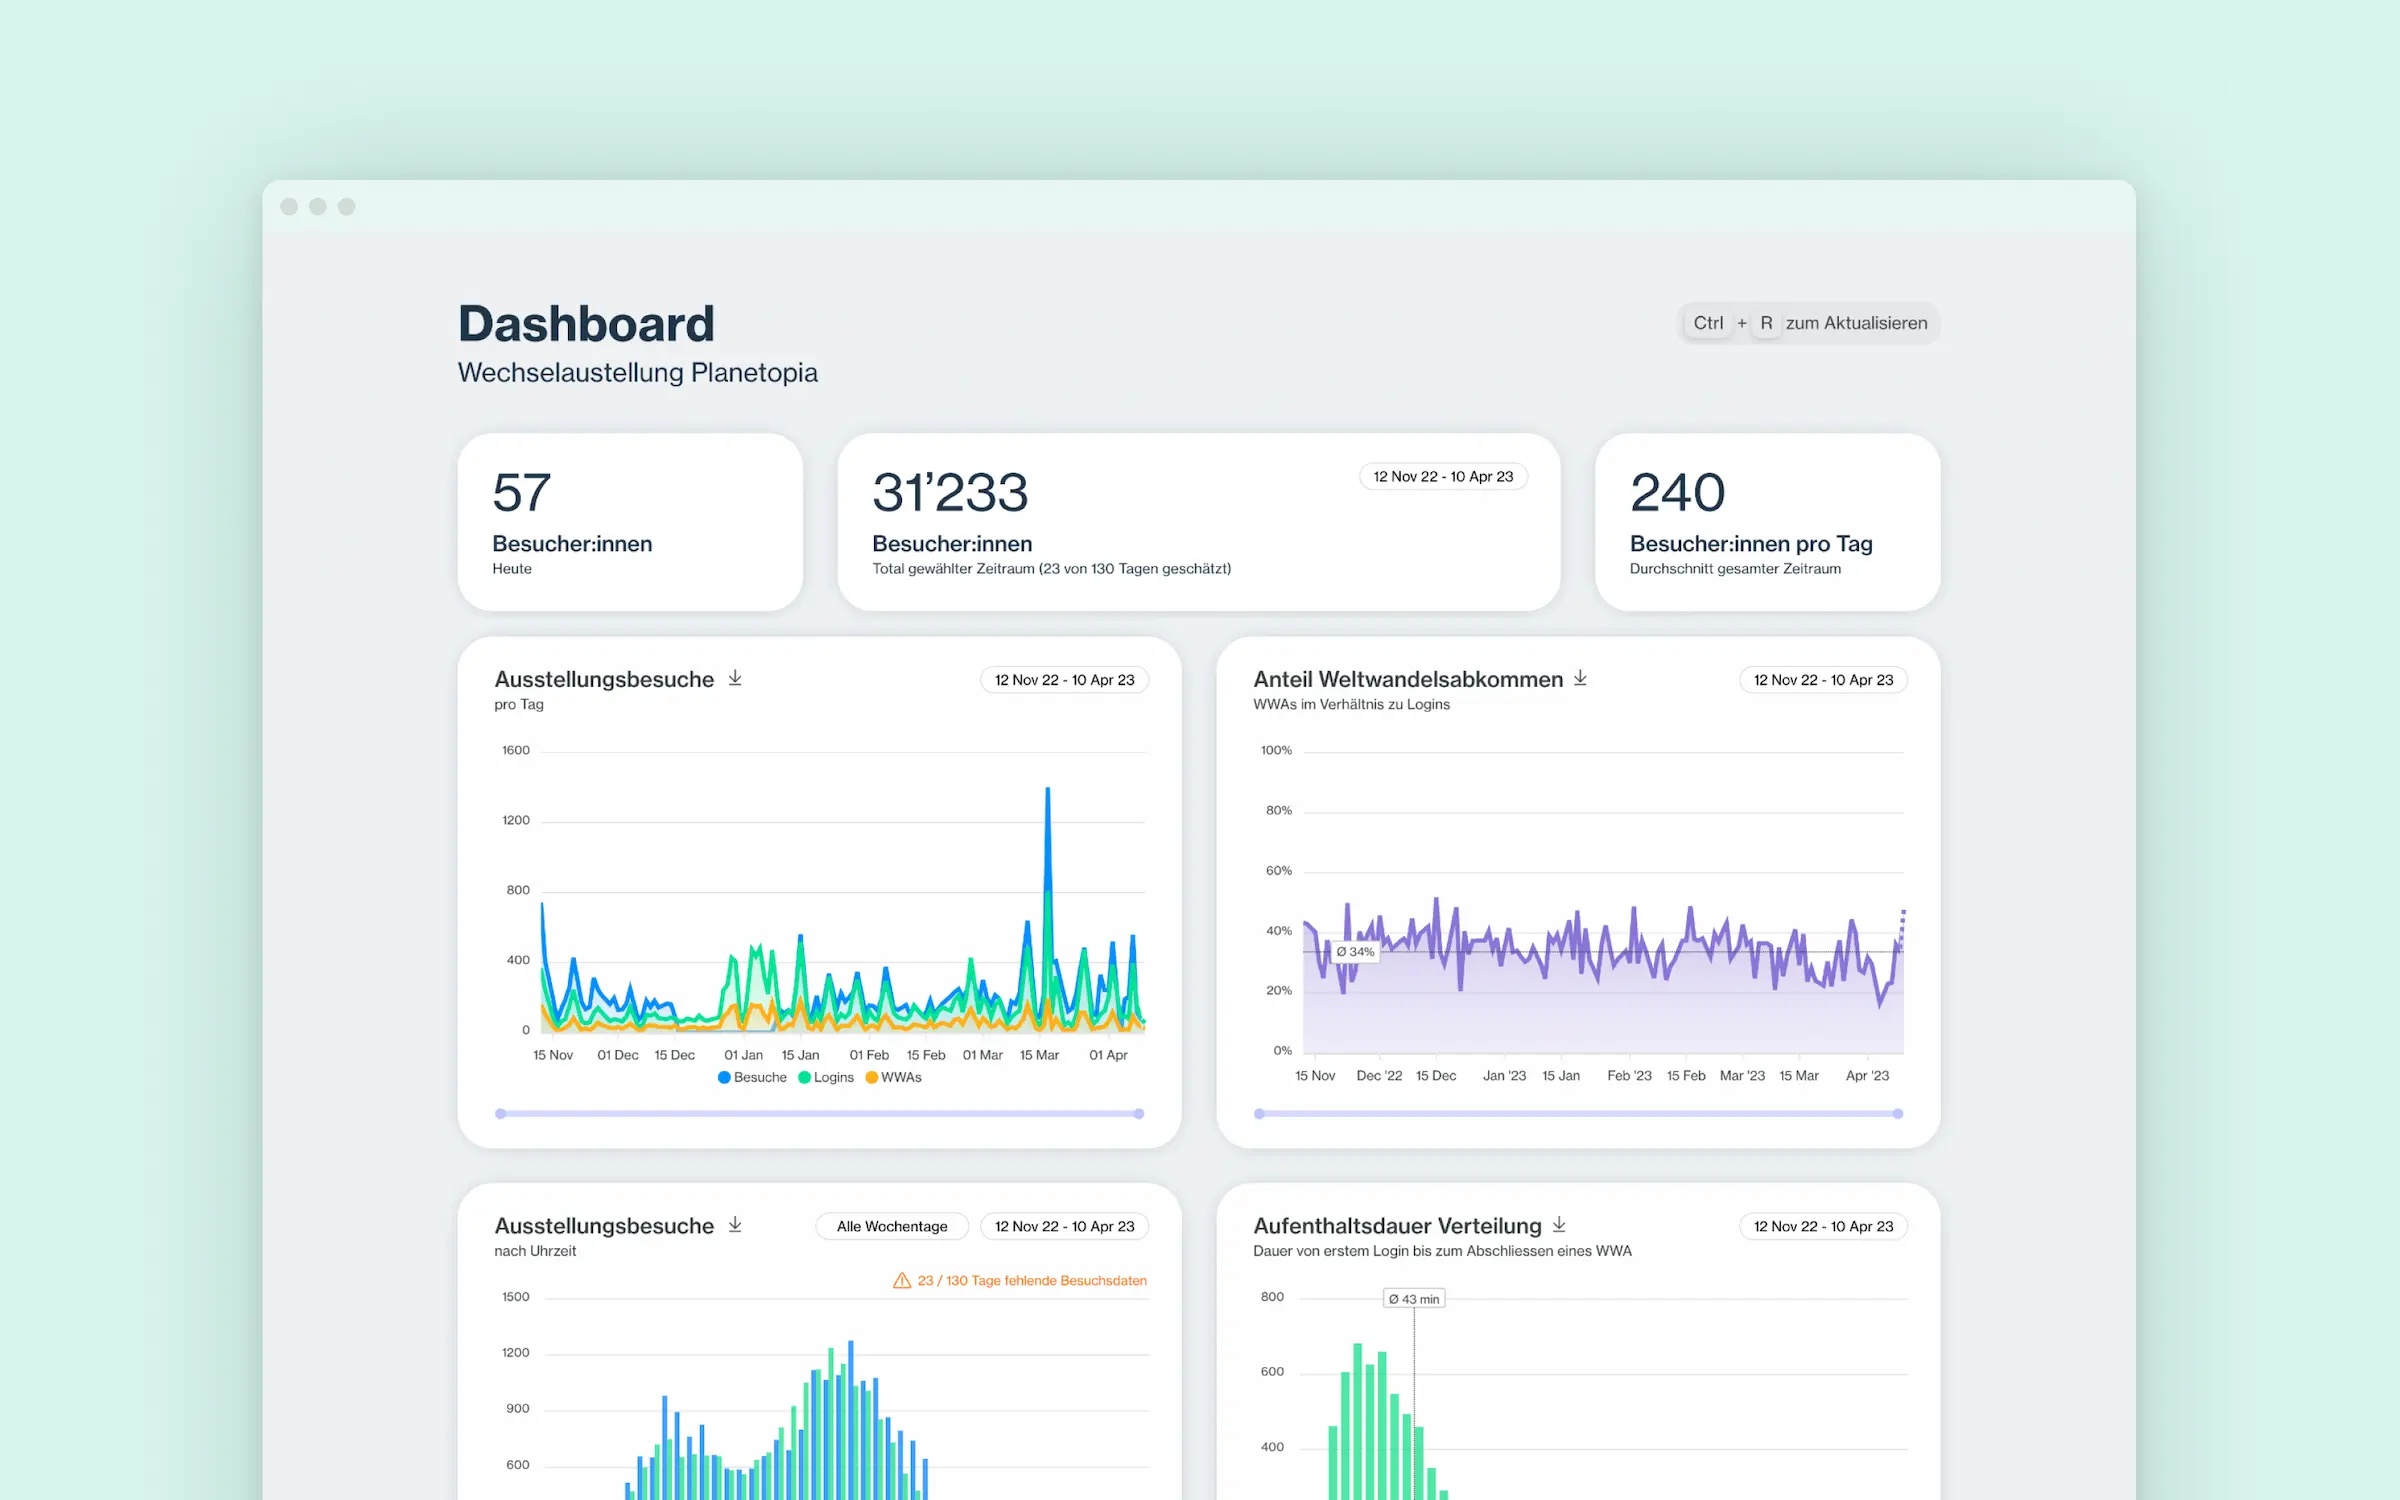
For the exhibition "Planetopia" at the Museum of communication Berne I designed and programmed the interactive digital track through the exhibition in close collaboration with the curators. At a dozen touchscreen quiz stations spread throughout the exhibition, visitors are encouraged to reflect on their personal sustainability practices in their daily lives. At the final stage each visitor receives an evaluation based on their answers and has the opportunity to sign a personalized world change agreement. In addition to the quiz terminals, I designed and programmed an application for anonymous live exhibition data evaluation, which provided the museum management with valuable new insights into visitor behaviour.
- Museum
- Interactive Exhibition
Type
Work Project
Museum of Communication, Berne
Roles
UX & UI Design, Programming
Technologies
Svelte, Electron, Express, Linux Mint, GraphQL, Apexcharts
Link
Context
During my time at the museum, I had the opportunity to develop an interactive application for the "Planetopia" exhibition, which explores sustainability issues. The exhibition itself is also committed to sustainable practices and was constructed using over 90% reused materials. For the touchscreen stations, we repurposed old computers that had been sitting in the museum basement for ten years. Due to the exhibition preparation being behind schedule, the project timeframe was quite tight. I had just two months to complete the entire UX/UI design, programming and setup for the interactive stations, which were conceptualized by the curators. I was entrusted with the main responsibility for the creative and technical implementation of the application.
Process
After sketches on paper, I created a clickable wireframe prototype in Figma and conducted user testings with museum visitors to identify and improve weaknesses in dialog texts, user interface architecture, general flow and tasks as well as the RFID chip interaction. Based on this feedback, I created several design variations in Figma and started programming in parallel. For the technical implementation, I worked together with an external programmer, who primarily focused on integrating the RFID readers and email delivery, while I concentrated on the general application architecture, logic and front-end development. Following the exhibition's successful launch, I independently designed and programmed the entire evaluation software.
Credits
Quiz stations
Idea & Content: Ueli Schenk, Alexandra Heini
UX & UI Design: Jonas Wolter
Programming Frontend & Backend: Jonas Wolter, Jean First
Programming RFID-Readers: Jean First
Debugging, Stability Monitoring: Jonas Wolter
Dashboard application
Concept, Design, Programming: Jonas Wolter