Can we stop forest decline?
Data Visualization
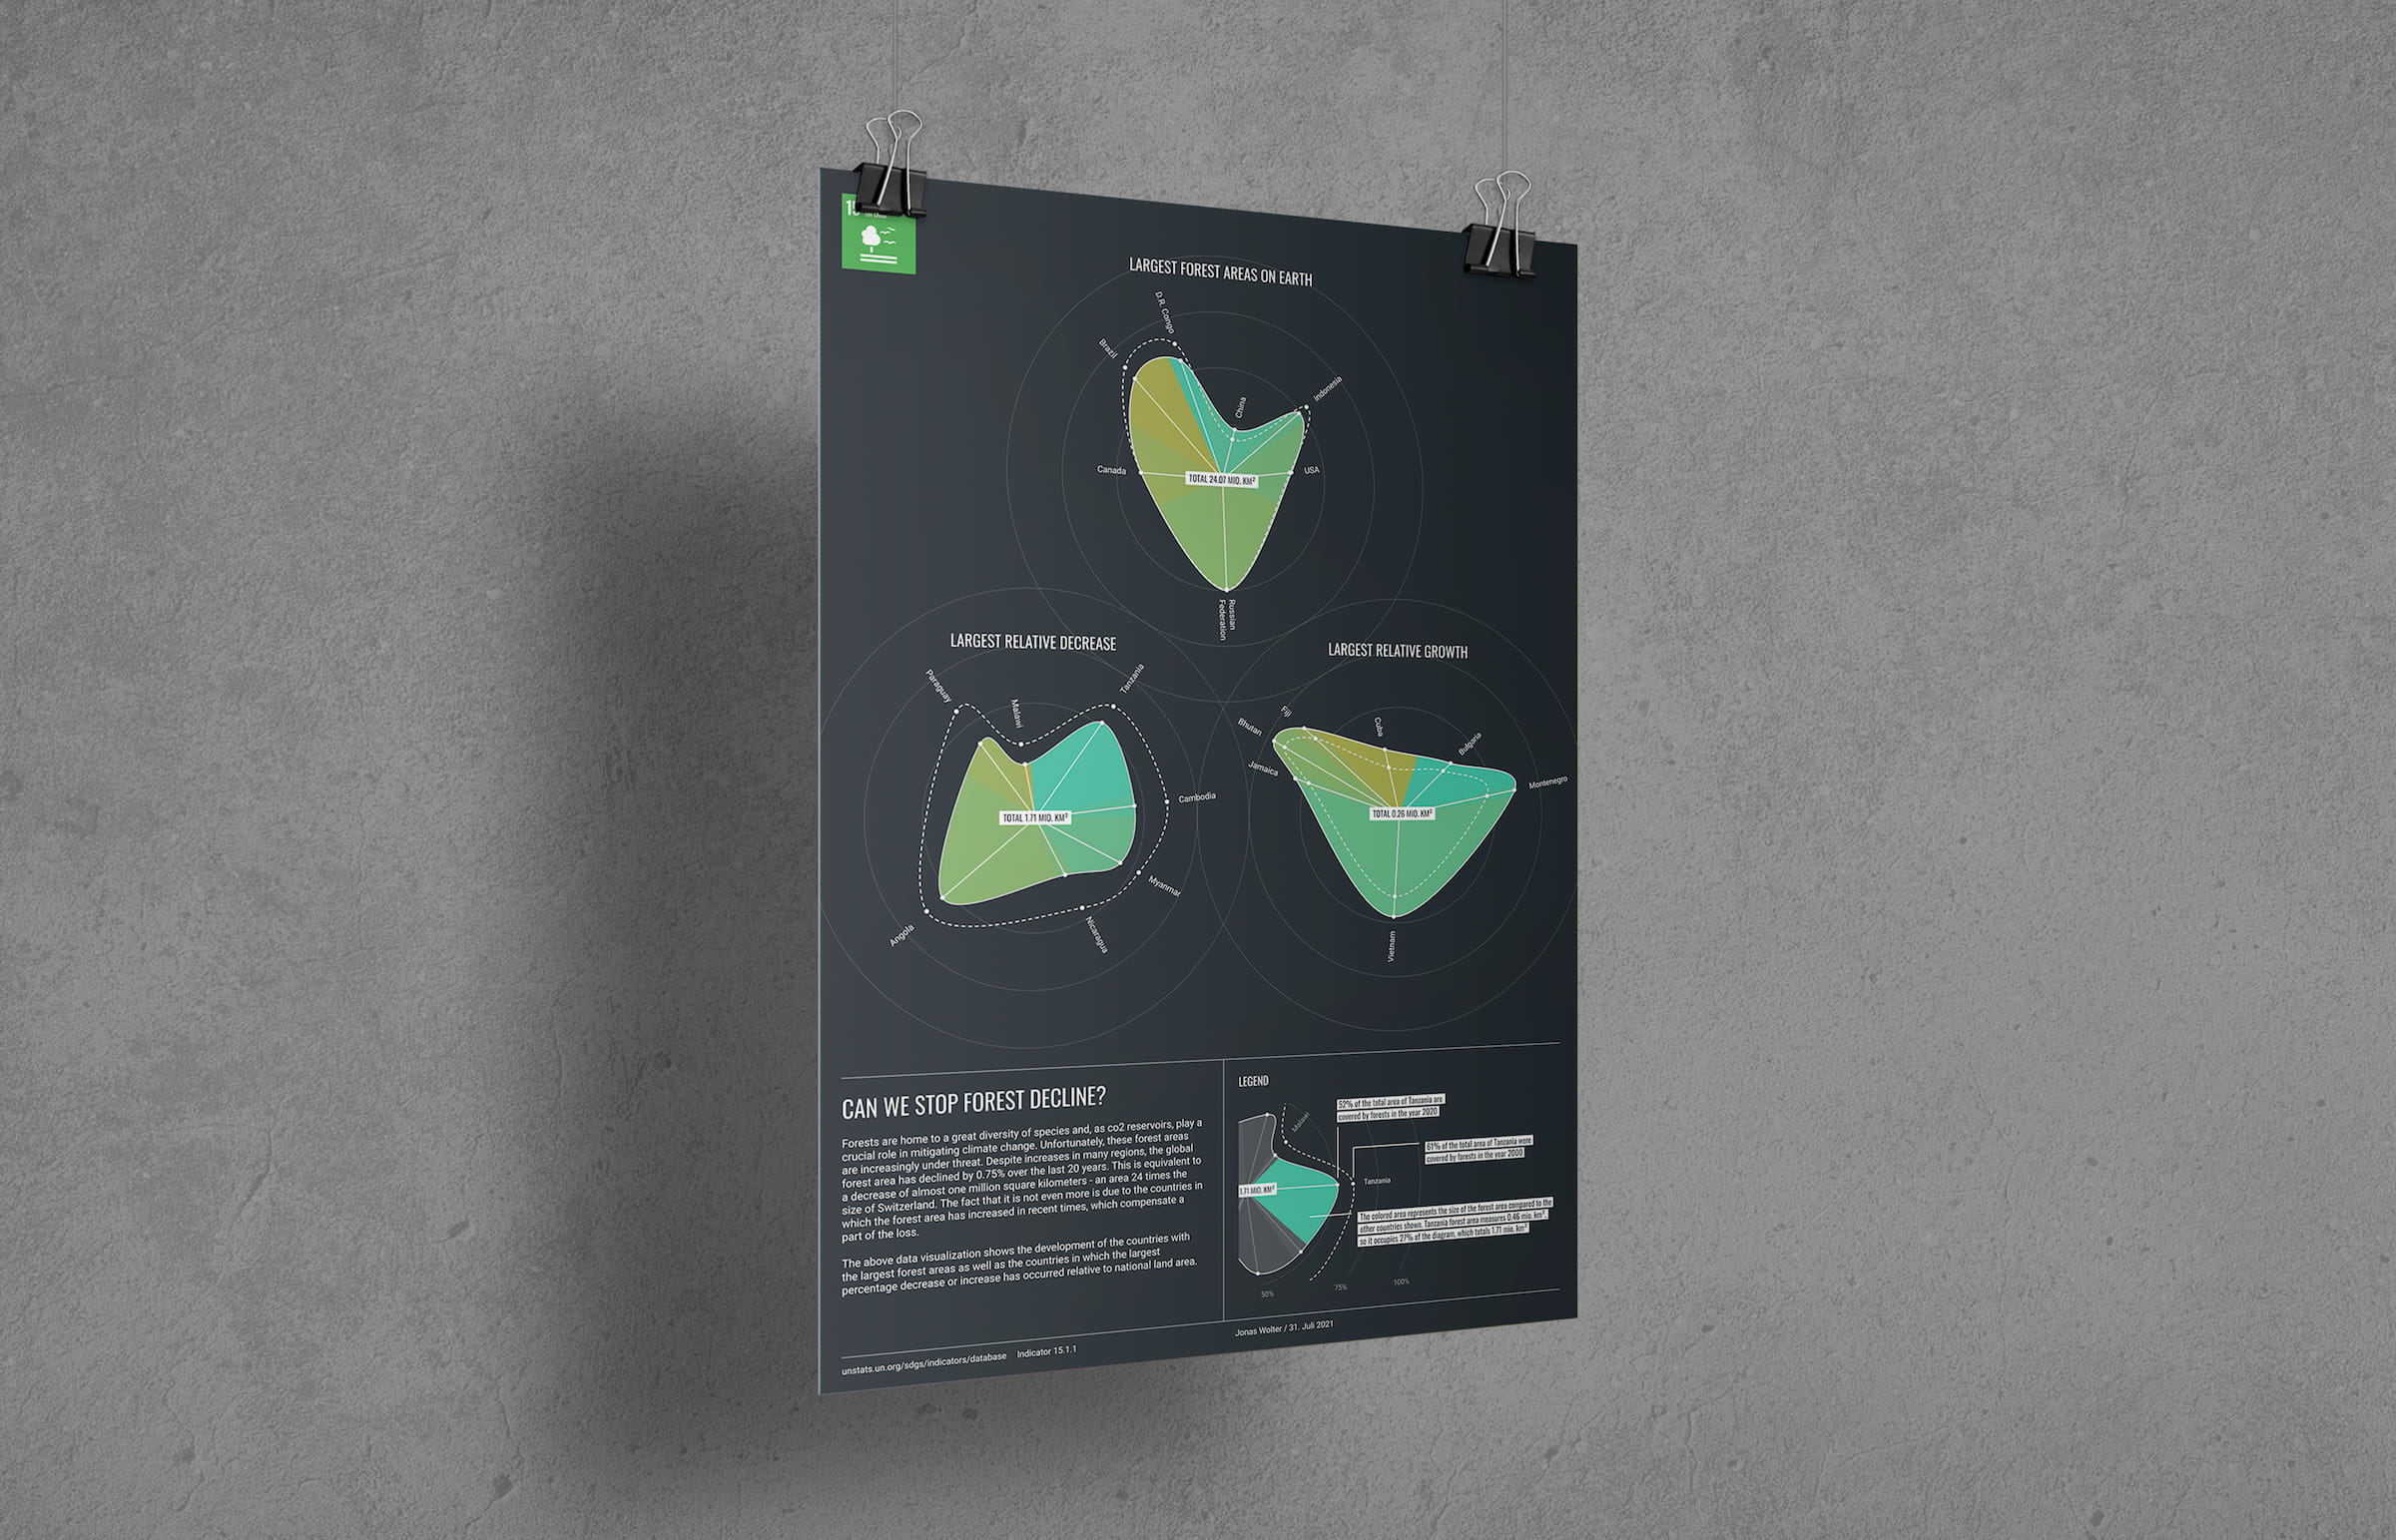
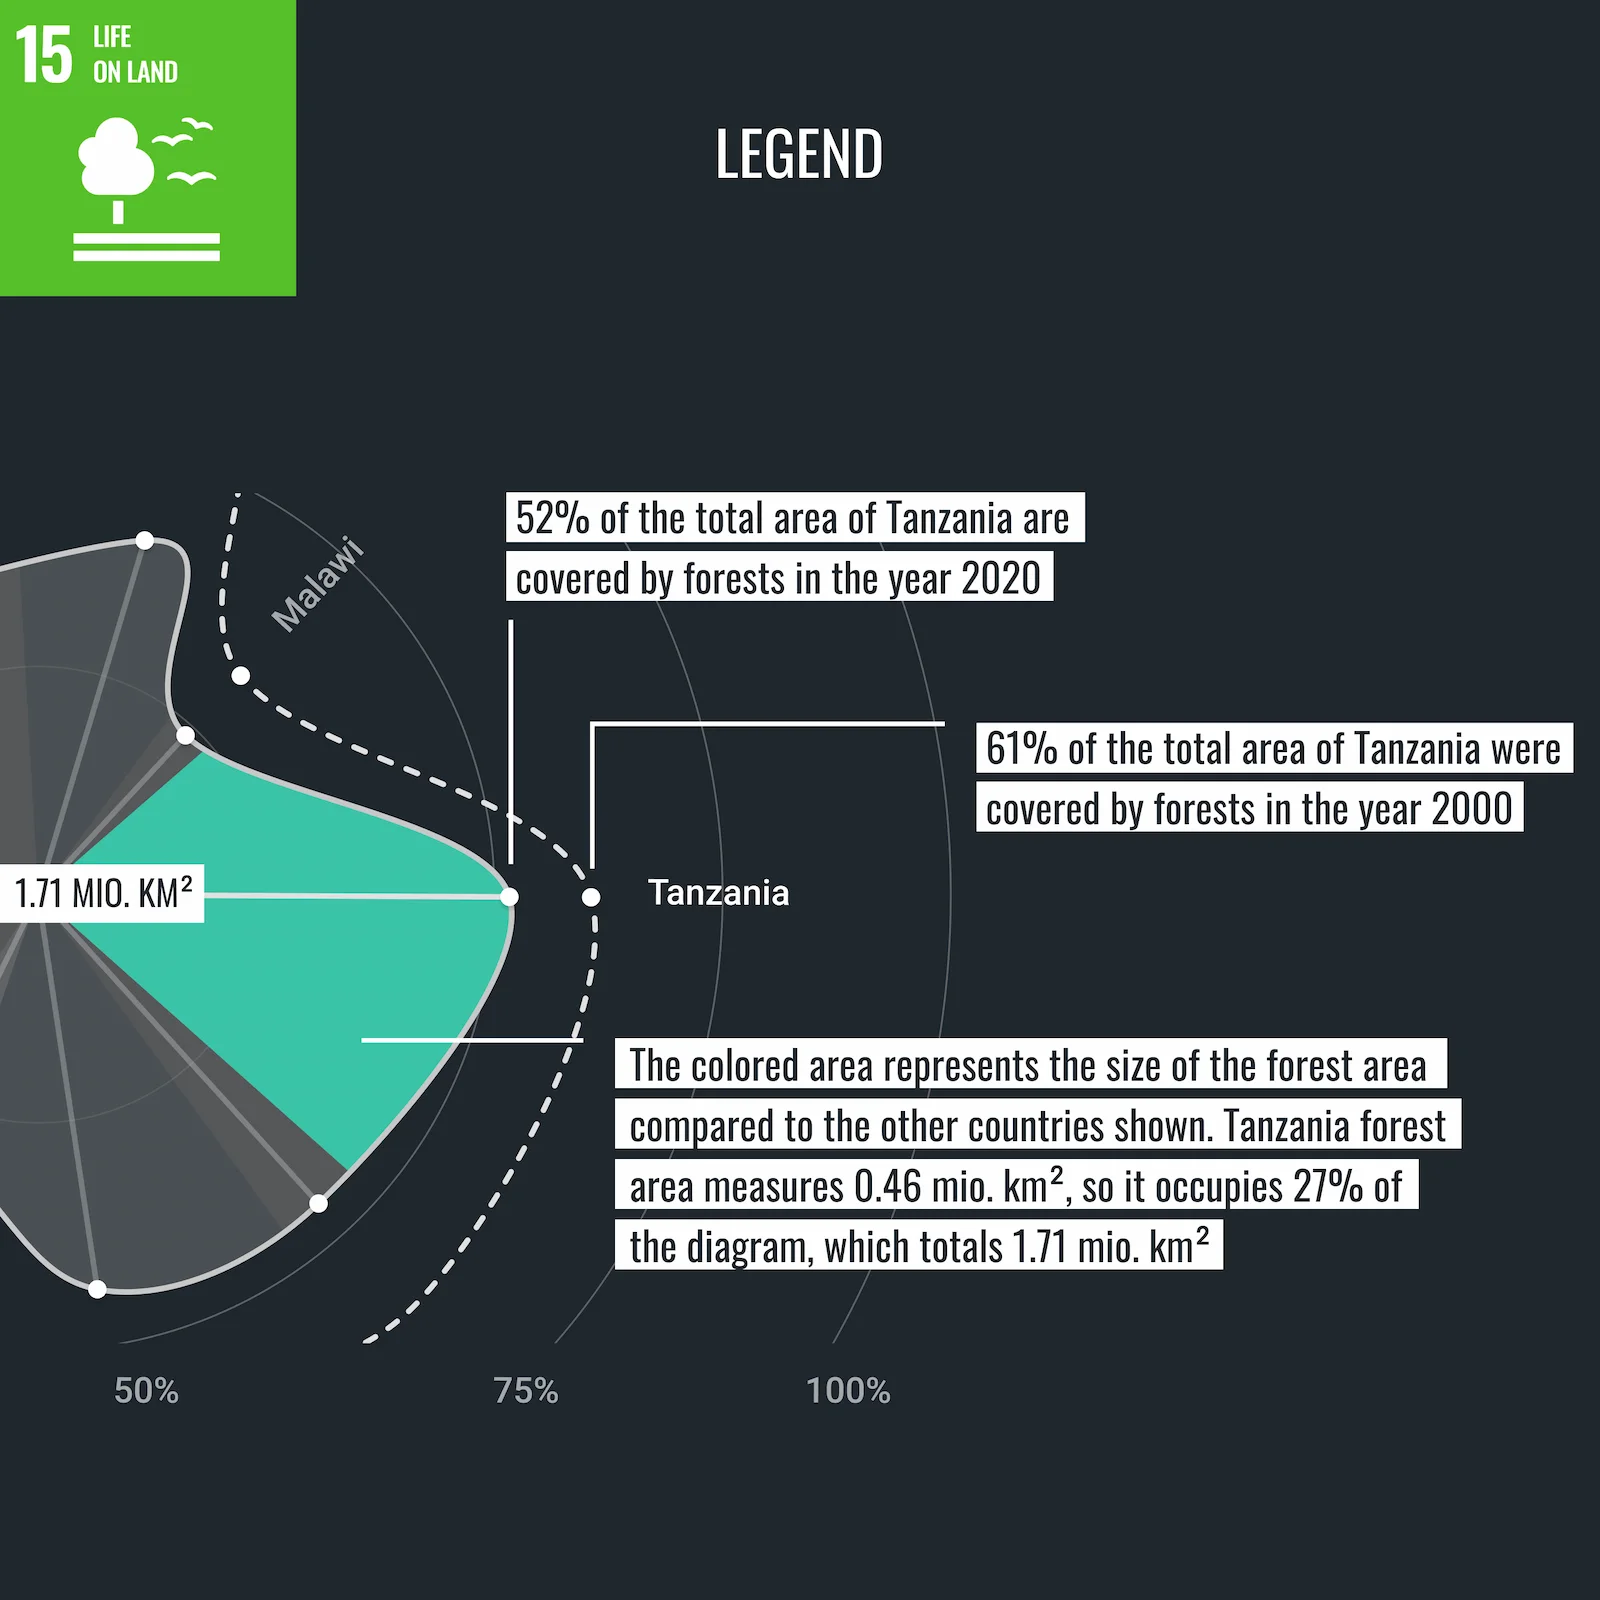
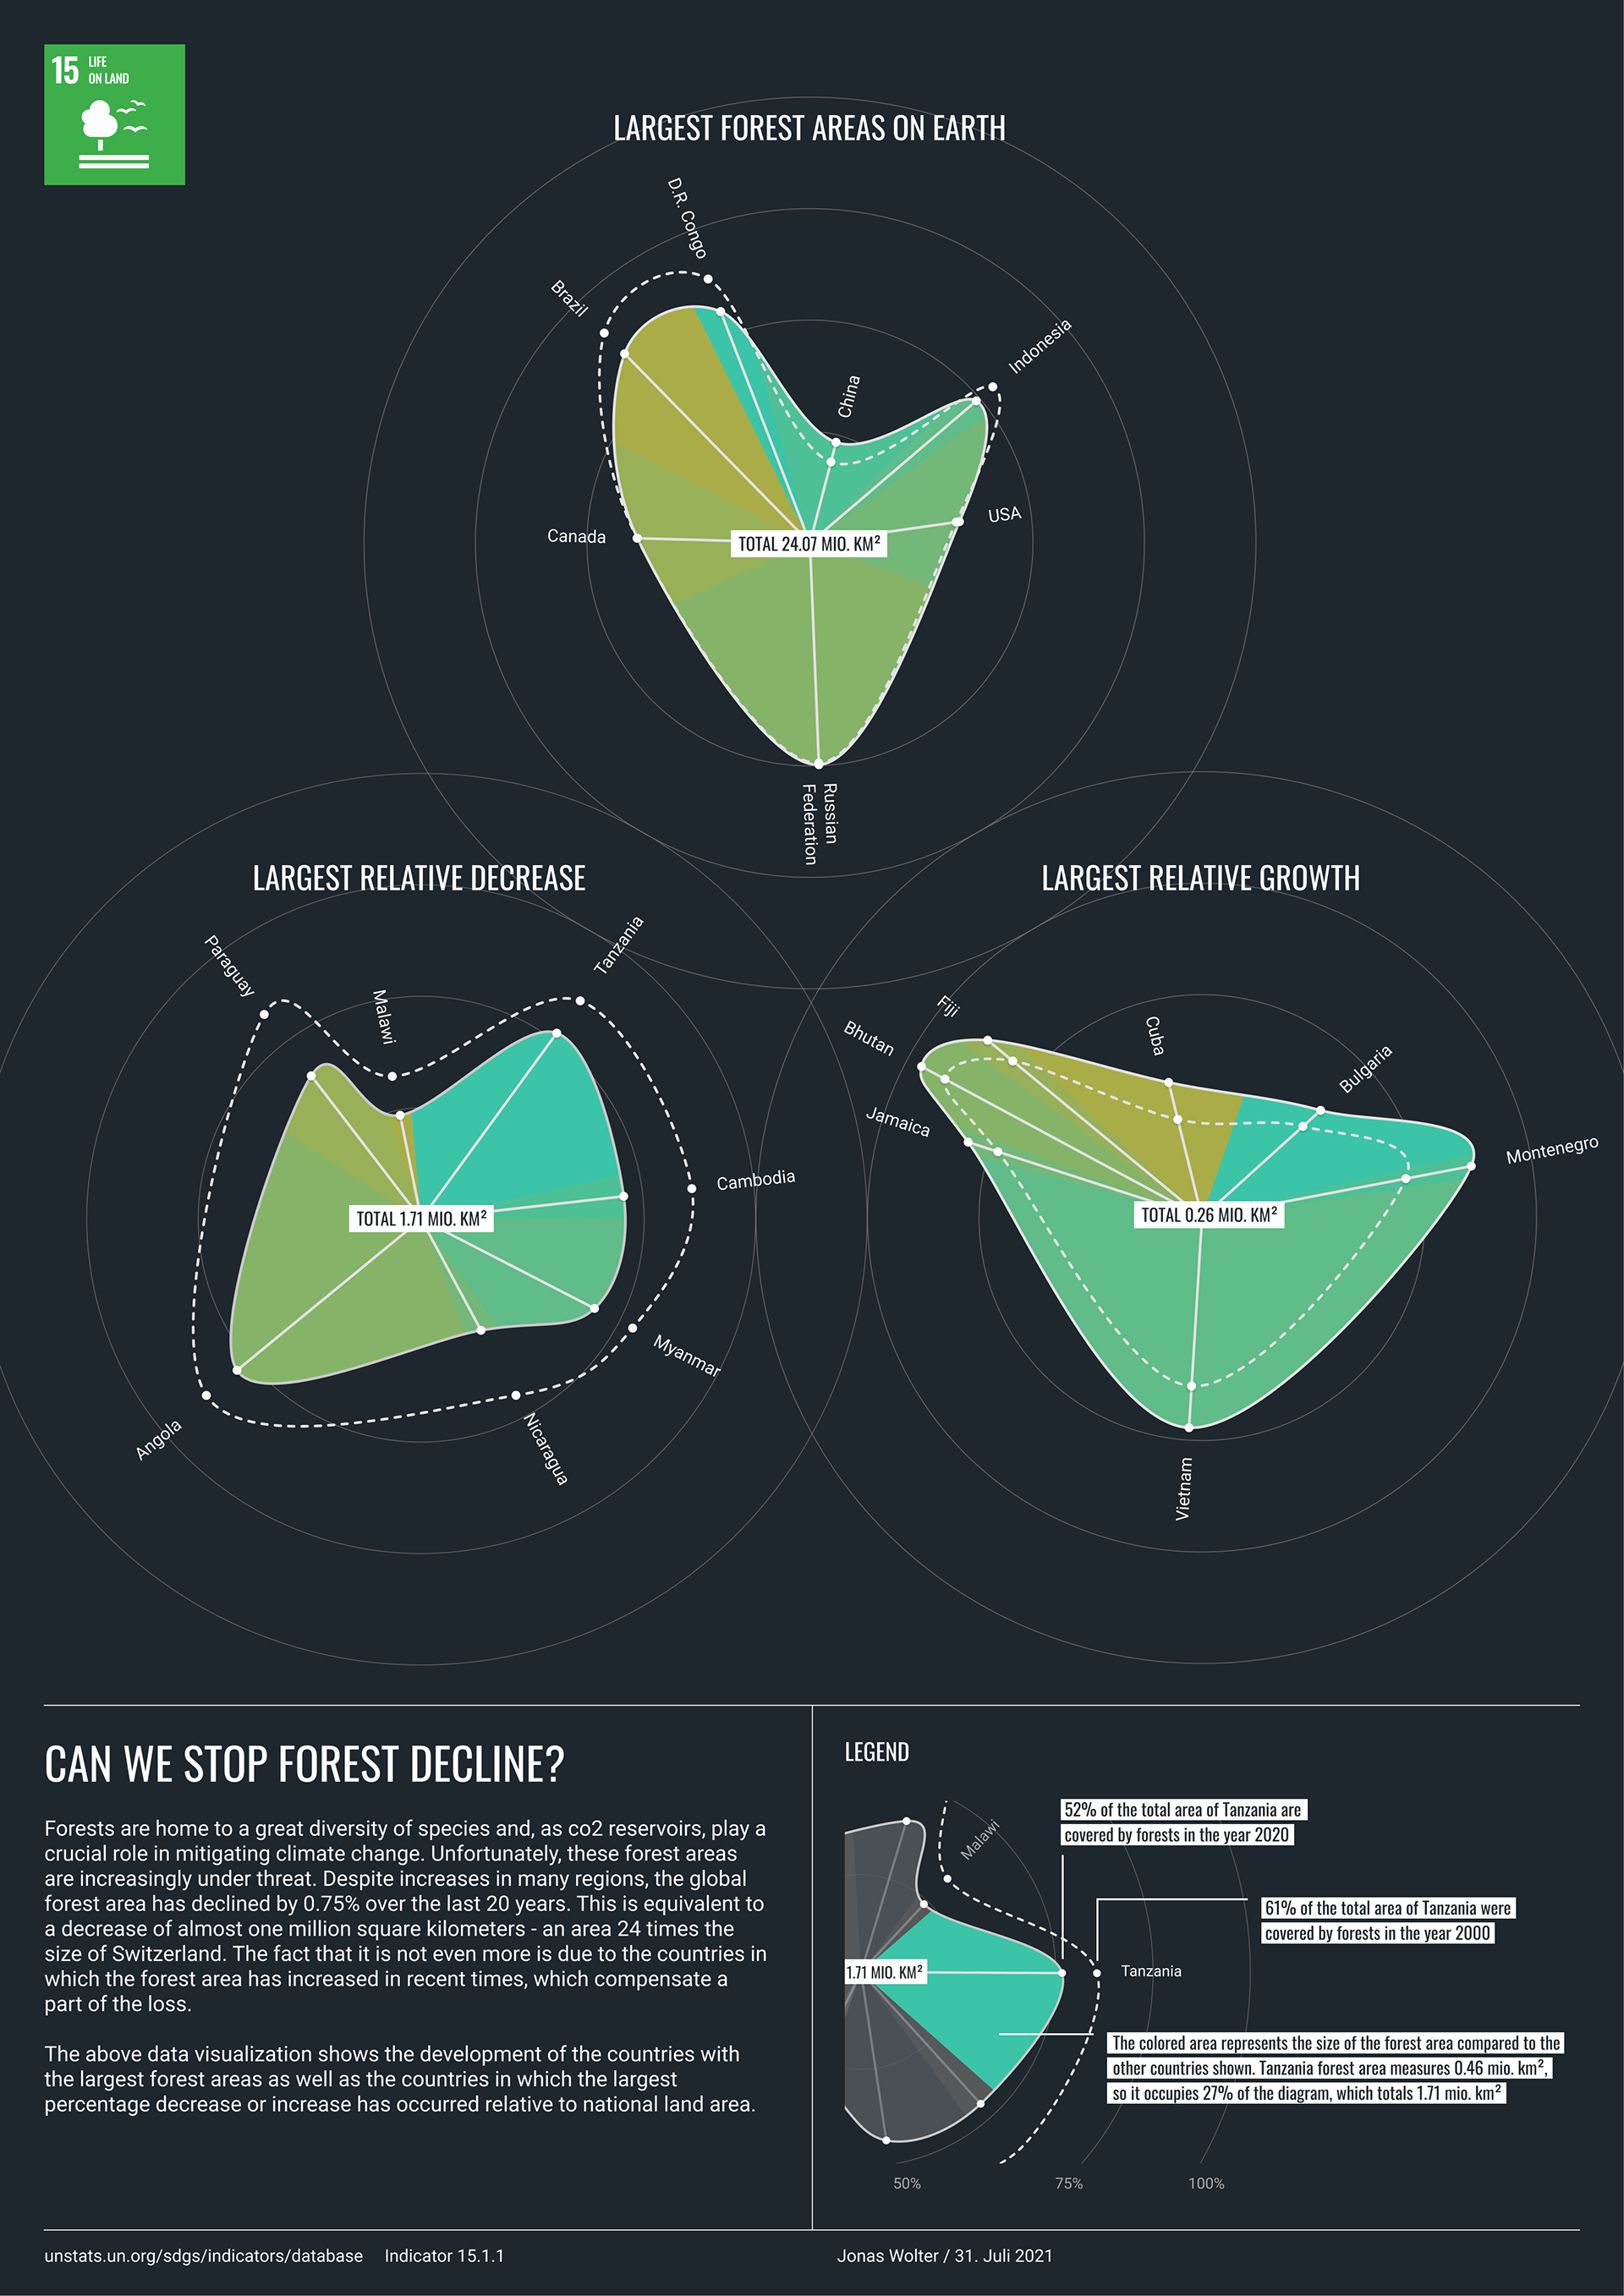
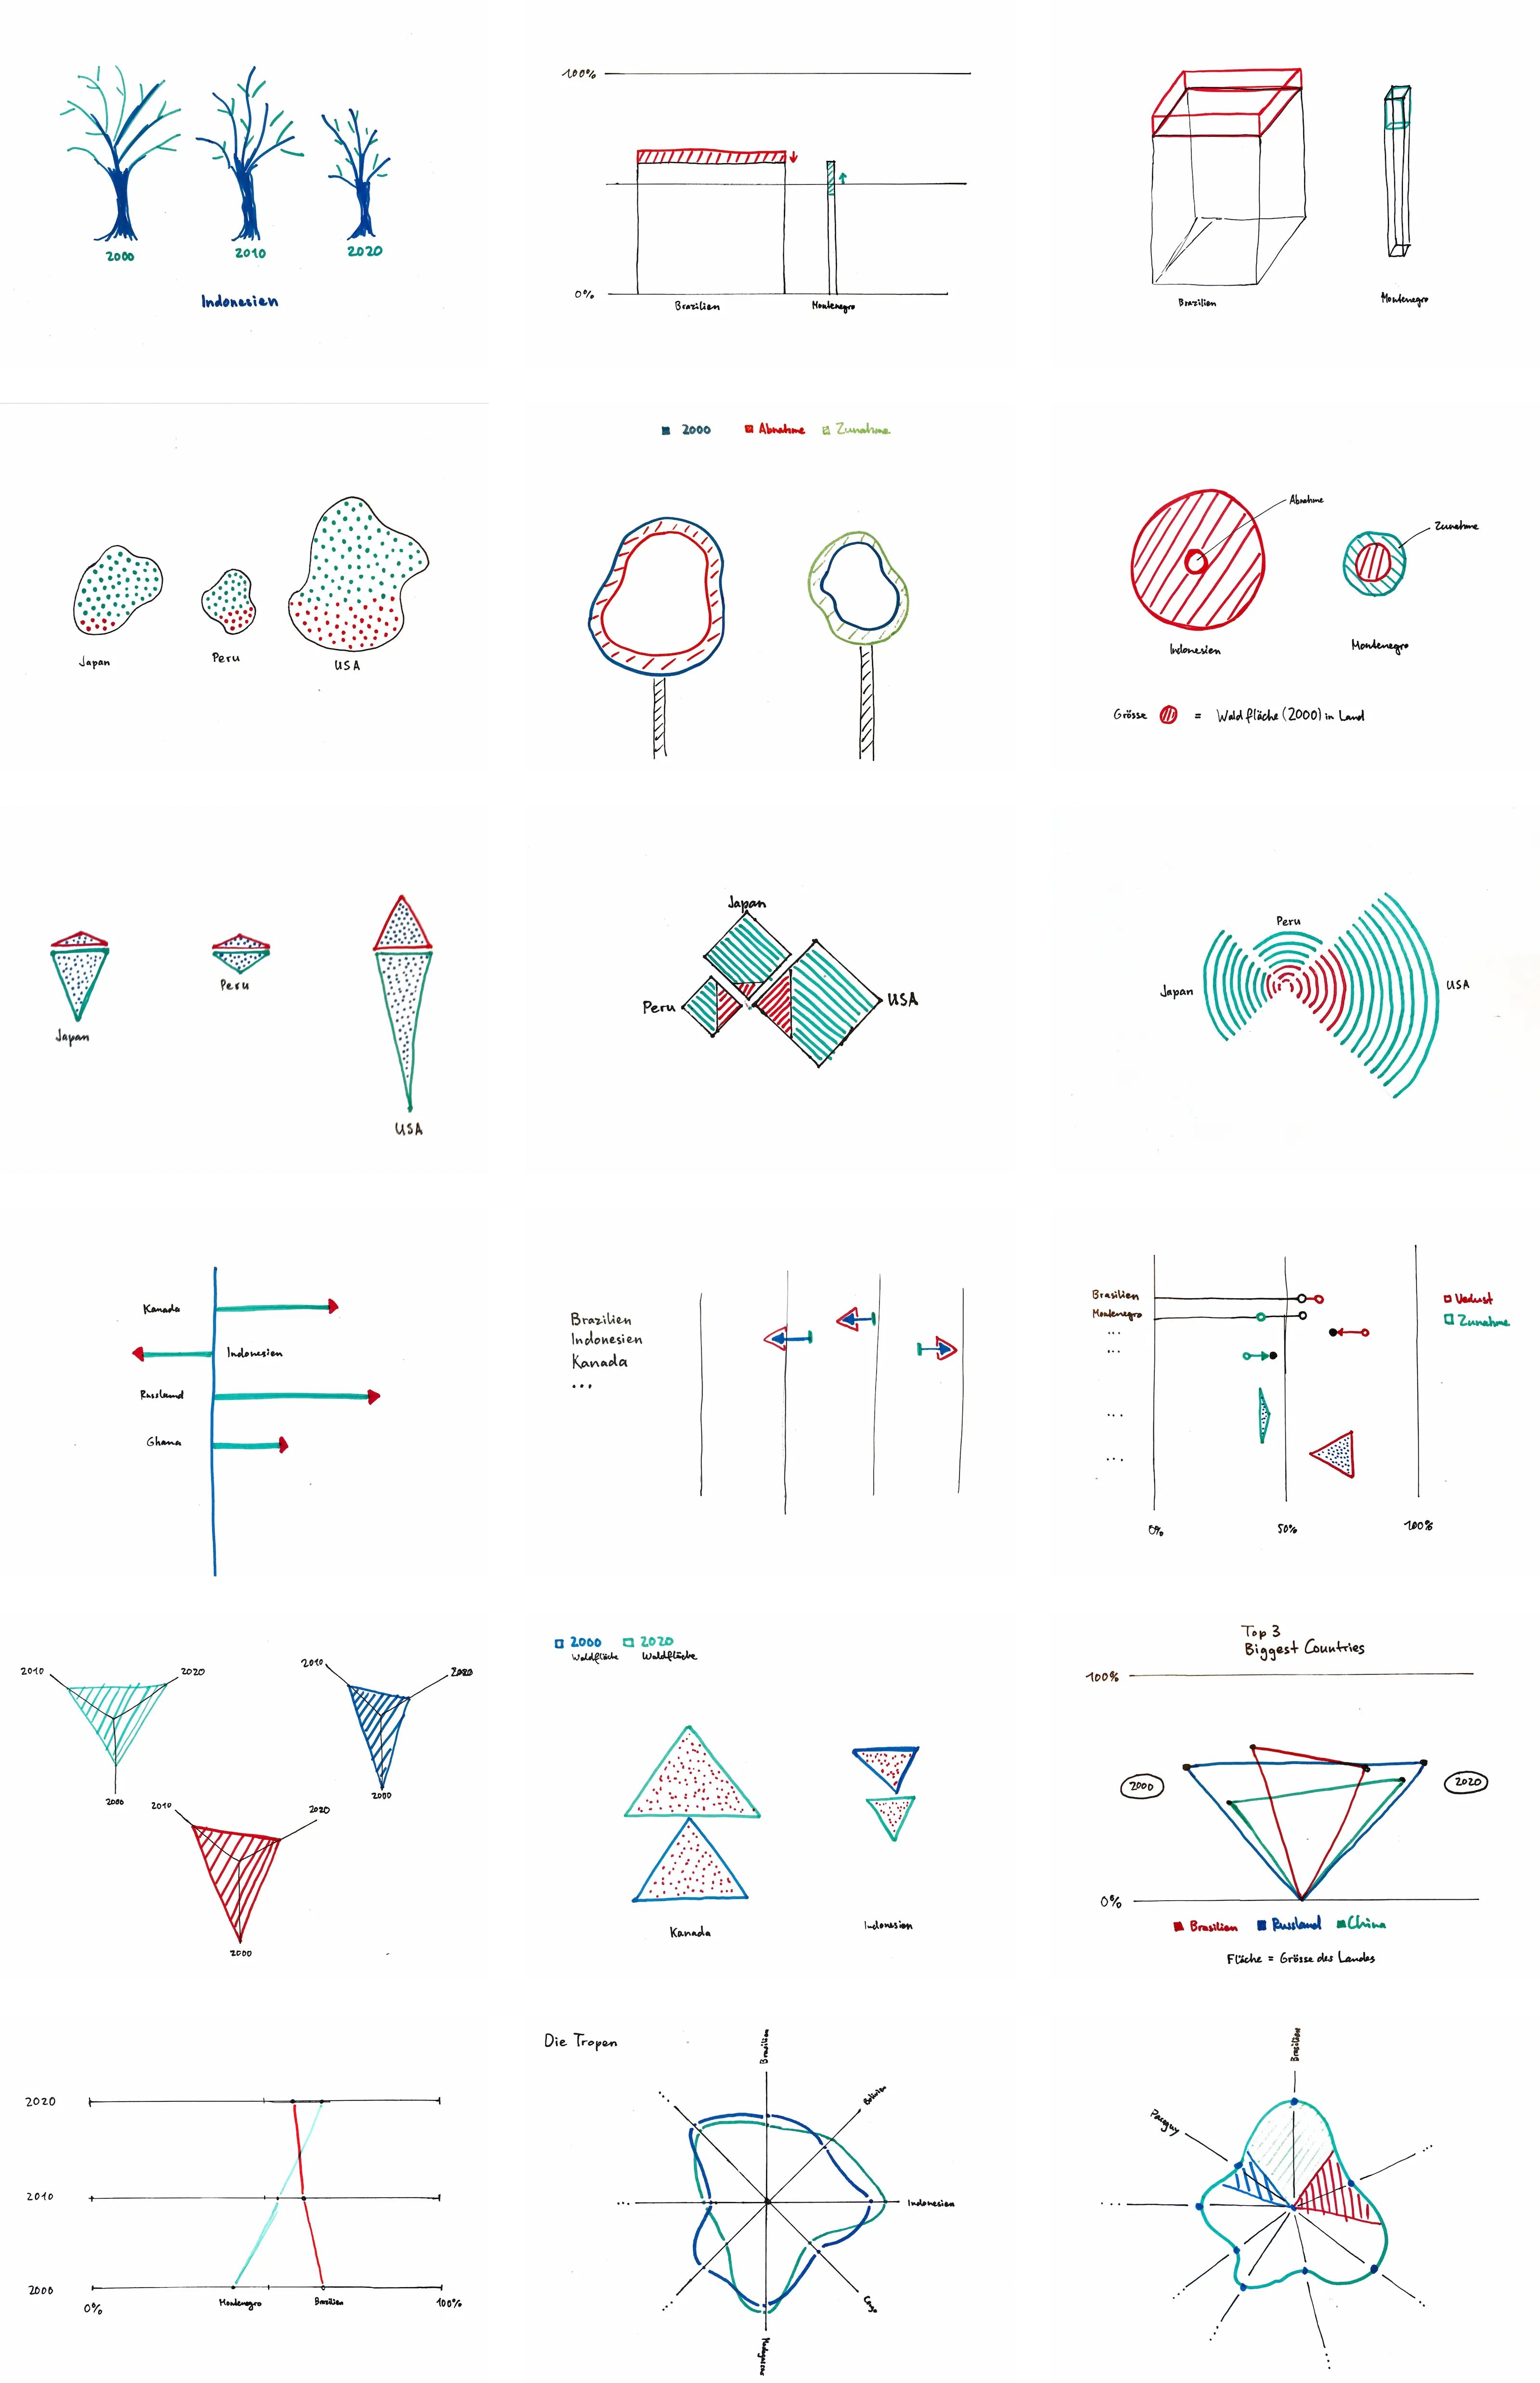
For the SDGViz Award of the Swiss Federal Statistical Office, I developed a new type of data visualisation that shows the development of global forest areas over the last 20 years. The infographics were generated in P5.js with a specially developed algorithm for balancing the curve areas.
- Data Visualization
- Global Deforestation
Awards
2nd prize SDG Visualization Award, United Nations World Data Forum
Type
Course Project
Roles
Research, Data Analysis, Design, Coding
Technologies
P5.js, Tableau, Excel, Figma

Credits
Research, Data Analysis, Design, Coding: Jonas Wolter